This page first describes the Milestone Assignments referenced in the course calendar. Each section below explains the purpose of the milestone, what to submit, and what “good” typically looks like. Grading rubrics are described at the end of this page.
Milestone Assignment descriptions
Purpose:
Lock in a feasible analysis plan early, so you’re not improvising later. This is about scope, clarity, and workflow—not results.
What to include
Download the Analysis Concept Note template (.qmd)
- Working title (can change later)
- Your focal question (1–3 sentences; plain language)
- Study system and units of analysis (what is one “row,” conceptually?)
- Response variable(s) and predictor(s) you expect to use (draft list is fine)
- Hypothesized relationships
- Short bullets; include directionality when possible
- Data source and file plan
- Where the data live
- What you will name files
- What the folder structure will be
- Planned model family (tentative)
- e.g., GLM / GLMM / GAM / GAMM, and why that’s your first guess
- Potential complications you already suspect
- Missing data, non-independence, zero inflation, seasonality, etc.
“Good” looks like
- A question that is answerable with the data you actually have
- Reasonable scope for one semester
- A workflow plan that makes your project reproducible from day one
Purpose: For your Data Readiness Note, you will build upon your Analysis Concept Note. (Note that this does not mean that you should simply paste the information below at the end of your Analysis Concept Note; it means that you should recycle.reuse the materials from your Analysis Concept Note as a foundation for your metadata and data readiness statement.)
The primary goal of the Data Readiness Note is to demonstrate that your dataset is analysis-ready—or identify exactly what still blocks you. This is your chance to be honest about limitations before modeling.
What to include
The components in the list below should be included in your assignment submission; keep these in separate files for your own records, but please –if you can– combine them all into a single file before submitting via email.
Part 1: Metadata file It is strongly suggested you use YAML Metadata Template, but you may also create a temporary metadata document using a spreadsheet. Your submission should include a very good initial attempt at making a formal metadata file that includes the following kinds of information (but could include more):
- Dataset summary: Number of rows/observations, key grouping structure (site, individual, date, etc.)
- Data dictionary (lightweight): Variable name → meaning → units → type (numeric, factor, date)
- Missingness and exclusions: what is missing, where is it missing from, and what you did about it (if anything)
- Measurement and uncertainty notes: Known measurement error, detection limits, observer effects, instrument drift, etc.
Part 2: Basic Exploratory Data Analysis outputs This component should include minimal but informative exploratory data analysis. You do not need to show density plots of all 1000+ variables. Highlight a few approaches that detected problematic issues, if possible. Again, make this useful for your own documentation purposes. This short section should include:
- Basic graphs or tables
- 1–3 plots that reveal structure (distributions, relationships, time trends)
- A short paragraph interpreting what matters
- Readiness decision
- “Ready to model” or “Not ready yet,” with a clear plan to get there
Part 3: AI-based Evaluation Table A document showing that you used JackalopeGPT to include the final Evaluation Table (i.e. rubric-tested) output from JackalopeGPT.
“Good” looks like
A submission of high quality will demonstrate:
- that you have a clear idea about (and can explain) what each variable means and whether it is trustworthy
- that you recognize your responsibility to document your metadata in a way that can be understood by future users
- that you purposefully applied basic approaches of Exploratory Data Analysis (and have not used this as a simple plot dump)
- that you are ready to move on to data analysis!
Purpose:
Put a real model on the table. This is a draft: imperfect is fine, but it must be runnable and defensible.
What to include
- Your current model formula(s) (plain language and/or code notation)
- Model type (GLM, GLMM, GAM, etc.) and why it fits the data structure
- Key diagnostics or checks (draft level)
- Anything that suggests it’s “in the ballpark” or clearly broken
- One short interpretation paragraph
- What the model suggests (careful language; no over-claiming)
- A short “known issues” list
- What you know is wrong or incomplete
- What you plan to try next
“Good” looks like
- A runnable model aligned with your question
- Honest diagnostics and a clear plan to improve
Purpose:
Freeze the core model so the rest of the semester can focus on prediction, interpretation, and reporting instead of endless tinkering.
What to include
- Final model specification
- Final formula, family/link, random effects or smooths, correlation structures if used
- Justification
- Why this structure is appropriate for the data and the question
- Model checks
- A small set of diagnostics you can defend
- Notes on remaining limitations
- What changes are no longer allowed
- After the lock, presentation and interpretation may improve, but model shopping should stop without compelling justification
“Good” looks like
- A stable model you can explain to a skeptical reader
- Evidence you tested assumptions (rather than hoping)
Purpose:
Practice disciplined interpretation and uncertainty-aware reasoning. This is where you show that you can tell the truth about what the model does—and does not—say.
What to include
- Main result(s) in plain language
- Uncertainty
- What is uncertain and why
- Confidence intervals, credible intervals, prediction intervals, or other appropriate summaries
- Prediction vs. inference clarity
- Are you predicting new cases, explaining mechanisms, or both?
- Sensitivity or robustness (lightweight)
- One small check that increases confidence (or reveals fragility)
- Limitations
- The most important threats to inference and how they affect interpretation
“Good” looks like
- Clear, honest claims tied directly to model output
- Uncertainty is centered, not hidden
- No story time beyond what the evidence supports
Purpose:
Draft the Results section you would submit in a real paper or report: concise, structured, and supported by tables and figures.
What to include
- Short orienting paragraph
- What you modeled and what the reader should look for
- Core results
- 2–4 key findings, depending on project scope
- Tables and/or figures
- Clean, interpretable, labeled, and referenced in text
- Minimal interpretation
- State what you found; deeper interpretation comes later or is clearly separated
“Good” looks like
- Findings are understandable without reading your code
- Figures and tables do real work
- Claims match the evidence shown
Purpose:
Assemble a complete, coherent draft that reads like a real scientific product. Structure and flow matter here.
What to include
- At minimum: Introduction, Methods, Results, Discussion (or equivalent)
- Consistent terminology
- Variable names, units, and definitions do not drift
- All figures and tables in near-final form
- References and citations, as appropriate
“Good” looks like
- A document that could be revised into something publishable
- Clear logic and honest uncertainty
- No missing major components
Purpose:
Demonstrate that you can revise strategically. You will not execute revisions; you will propose them.
What to include
- Top five revision priorities
- Ranked, with a sentence explaining why each matters
- What you would change (specific)
- “Rewrite paragraph X to clarify Y”
- “Replace Figure 2 with a plot that shows Z”
- What evidence you would need
- Additional checks, plots, sensitivity analyses, etc.
- If you had 10 more hours
- If you had 40 more hours
- What would you do that you cannot do now?
“Good” looks like
- Specific, actionable revisions
- Clearly prioritized and realistic
- Demonstrates mature judgment about improving inference and communication
General assignment submission requirements
For many assignments, at least a partial template is provided (e.g. YAML or QMD). You may choose to submit a raw Quarto Markdown file or submit a version of it rendered as a PDF or in HTML (viewable in a browser). As long as it is legible and, more importantly, makes sense within your own workflow, it works for me.
Here is a brief note about Quarto Markdown, which is preferred to R Markdown. While R Markdown is not obsolete by any means, it has a number of disadvantages compared to Quarto; these are summarized in the table below.
| age |
older |
newer |
| primary language |
R |
multi-language |
| document types |
reports |
docs, books, sites, slides |
| cross-referencing |
manual |
built-in |
| extensibility |
constrained |
modular |
So, in your own work, if you ever anticipate wanting to streamline your workflow, I recommend migrating your old R Markdown files to Quarto. Note that there are a few steps to do so, steps that involve changing file headers and syntax. I have had to do this with my older R Markdown files, and it doesn’t take much time. Quarto can really add huge advantages, including reproducible creation of scientific presentations (sometimes in minutes and not hours).
For this course, please use Quarto.
Grading
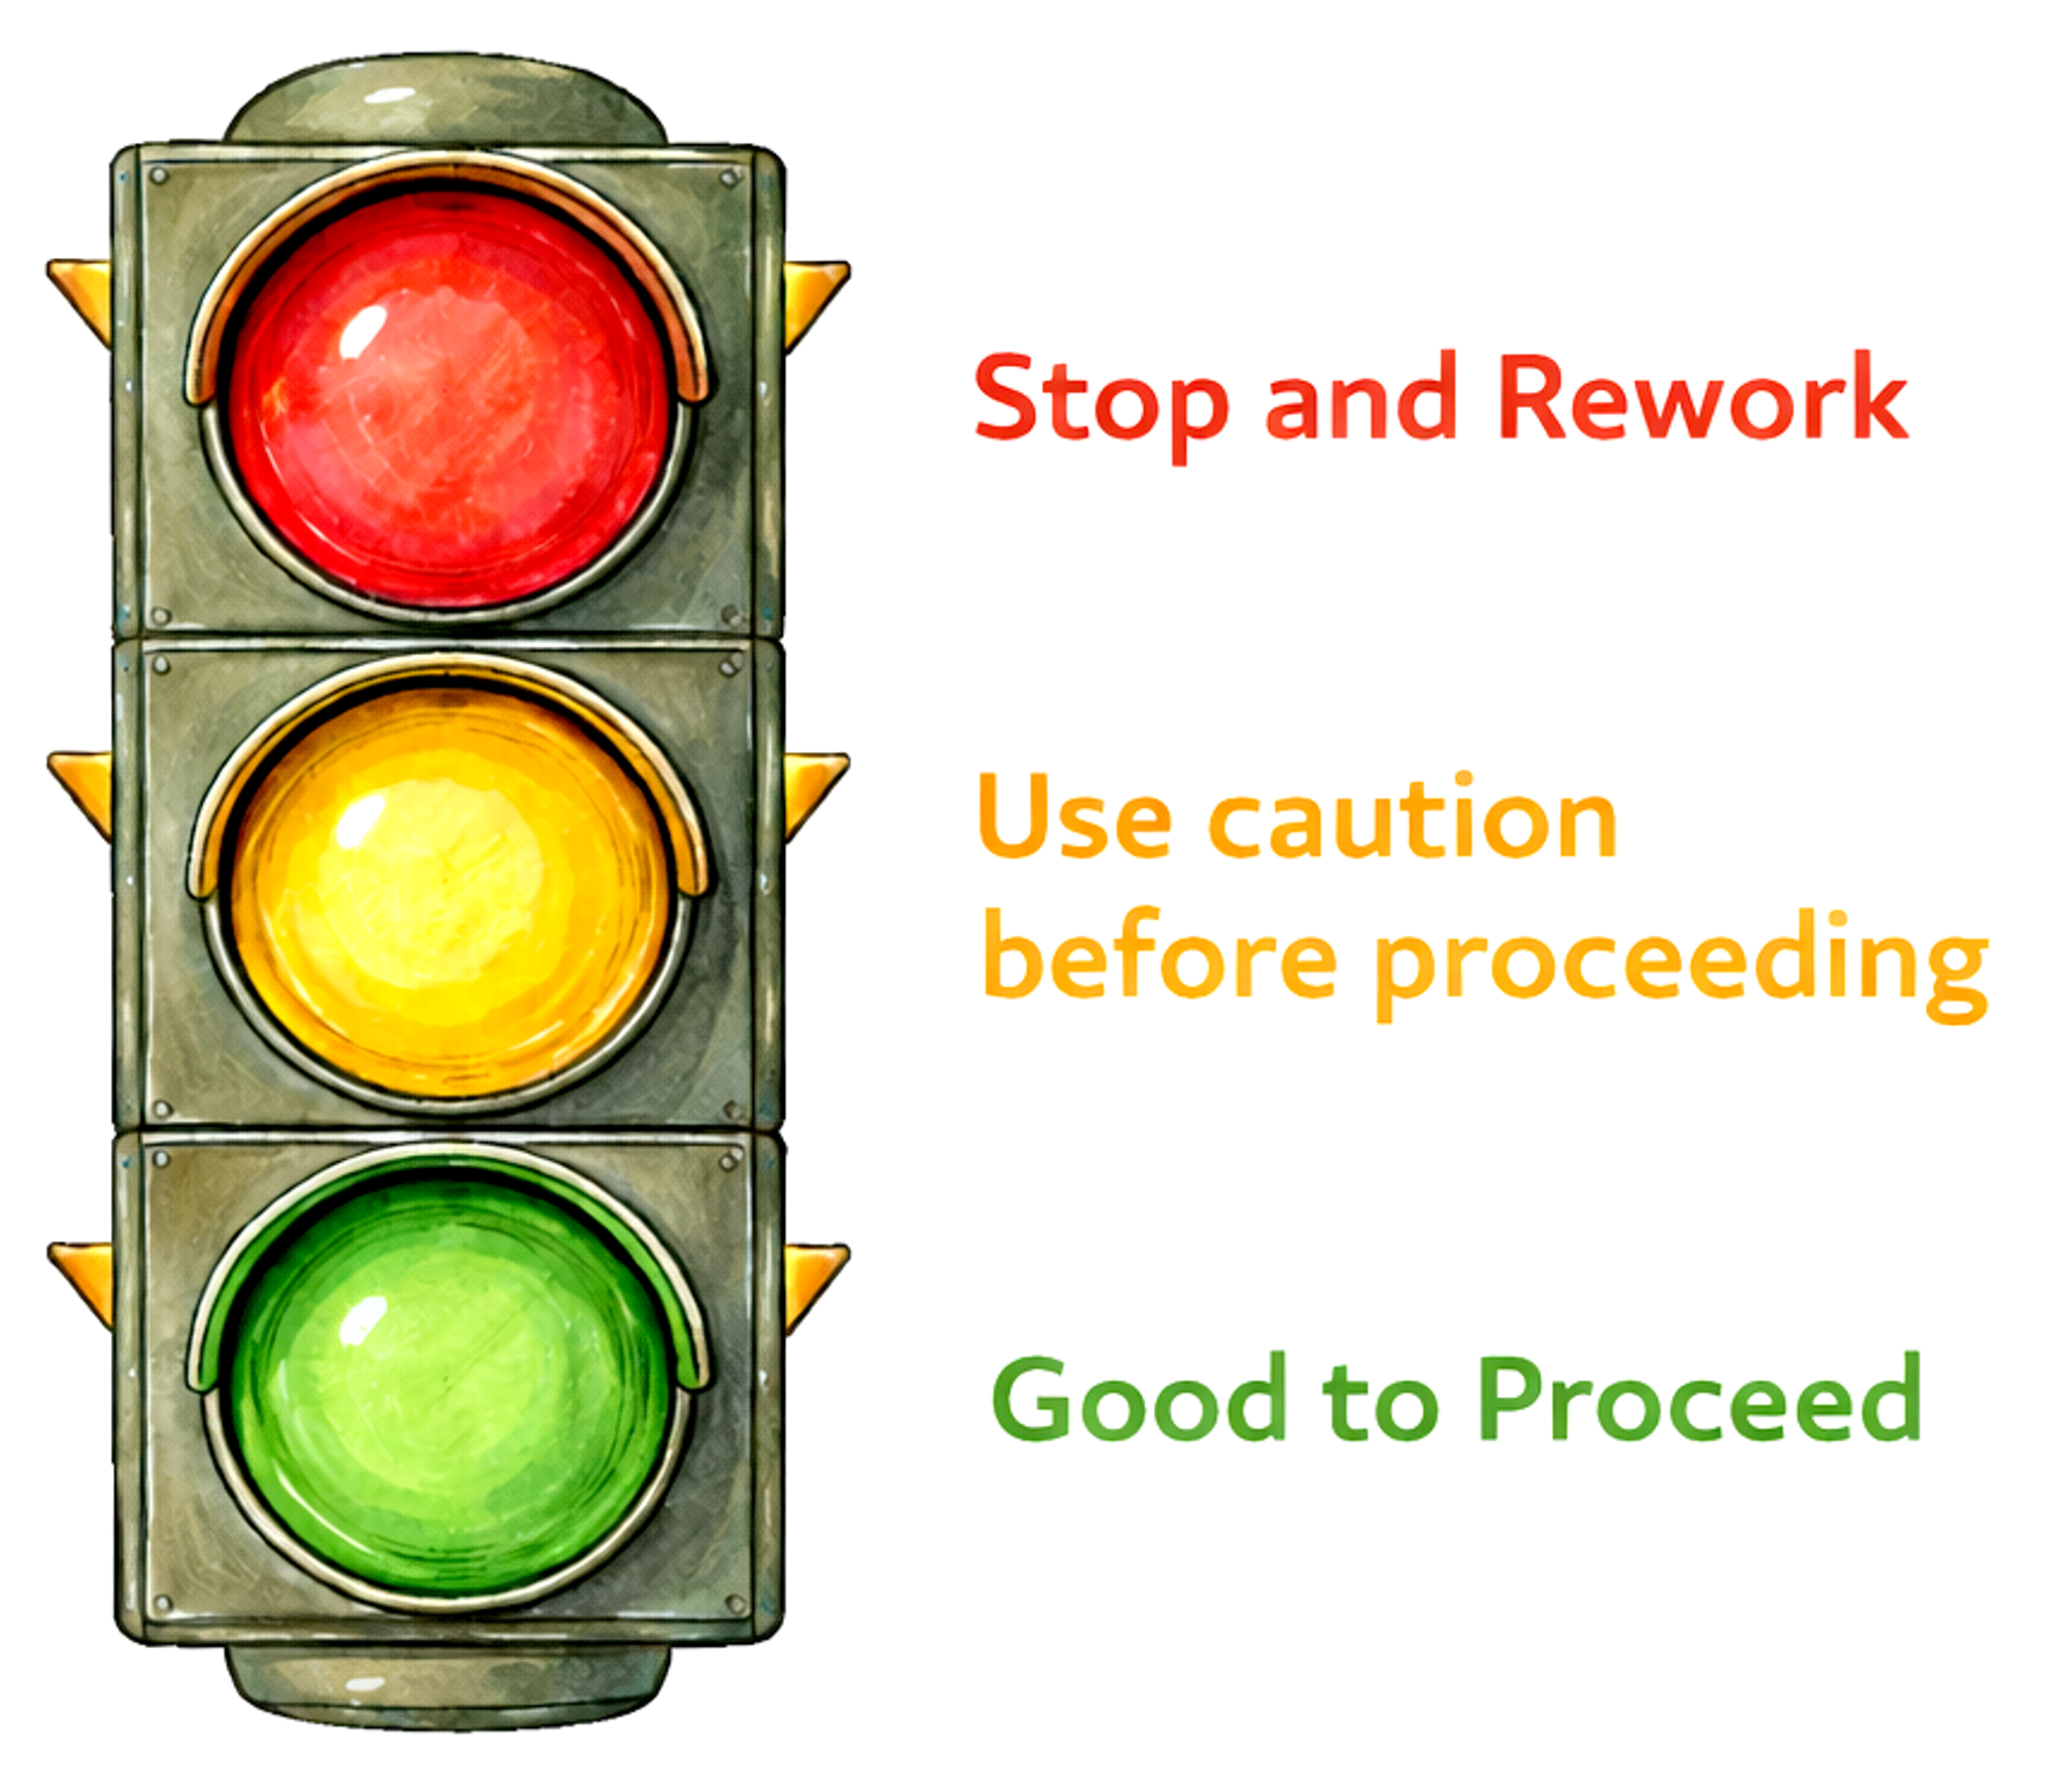
Numerical grades are downright loathsome. For all assignments, I use the Traffic Signal Grading Scale:
| Green |
Good to Proceed |
Scientifically coherent for this milestone |
| Yellow |
Exercise Caution |
Viable, but revision is required |
| Red |
Stop and Rework |
Not yet ready for scientific judgment |
Yellow is not bad. It just means there are certain elements that you should tighten up before moving on. Red is also not bad. It just means there are more elements that you should tighten up before moving on. Hmm…see a pattern here? Maybe top-tier science is built upon iterative improvements?
Universal Milestone Grading Rubric
The Traffic Signal Grading Scale applies to all Milestone Assignments. Grading reflects scientific readiness relative to the purpose of the milestone.
| Purpose & intent |
Clearly meets the core intent of the milestone |
Partially meets intent; key elements need revision |
Does not meet the core intent of the milestone |
| Question or objective |
Clear, focused, and appropriate for this stage |
Present but vague, drifting, or overly broad |
Unclear, unfocused, or missing |
| Alignment (question–data–methods) |
Question, data, and approach are coherently aligned |
Partial alignment; gaps or weak links remain |
Fundamental mismatch between components |
| Reasoning & assumptions |
Reasoning is coherent; assumptions or limitations acknowledged |
Reasoning incomplete or assumptions implicit |
Reasoning unclear or unsupported |
| Claims & language |
Claims are appropriate for the stage of analysis |
Some overreach or ambiguous language |
Claims exceed what the work can support |
| Course GPT self-check |
Used appropriately; issues addressed or justified |
Used, but issues only partially addressed |
Little or no meaningful evidence of self-checking |
| Scientific readiness |
Work is ready to move to the next stage |
Viable but requires targeted revision |
Not yet in a usable scientific state |
This universal grading scale is meant to help you quickly understand where your work stands, not to highlight small mistakes. My goal here is to make expectations clear, keep grading transparent, and help you focus on doing solid, defensible science –all without unnecessary stress over points or formatting (which we will let GenAI work on for you). The scale’s primary benefits include:
- It is easy to read. The traffic light color scheme (green, yellow, and red) tell you right away whether your work is ready to move forward, needs some fixing, or needs a more substantial rethink (the majority of good scientists’ ideas)
- It is the same for every assignment. I use this scale for all milestone assignments. Therefore, the standards are predictable for every assignment.
- It centers on scientific readiness, not scientific perfection (which, technically, does not exist). You are not being graded on having the “right” answer. What matters most to me is whether your question, data, and reasoning co-exist coherently together.
- It matches how real science works. Research almost never gets it right on the first try; drafts, checks, and revisions are normal.
- It allows for rapid feedback. GenAI will do some of the busy work associated with troubleshooting coding issues or improving clarity, which will give me more time to gauge the scientific readiness of your work. A win-win for us all!