2 Introduction
2.1 Welcome to Quantitative Analysis of (Messy) Field Data!
Thanks for joining us this term! I couldn’t be more pleased at the large size of the class this term! This means that there are more perspectives to help guide us through the following phases of data analysis:
Messy field or lab data → processed data → models → inference
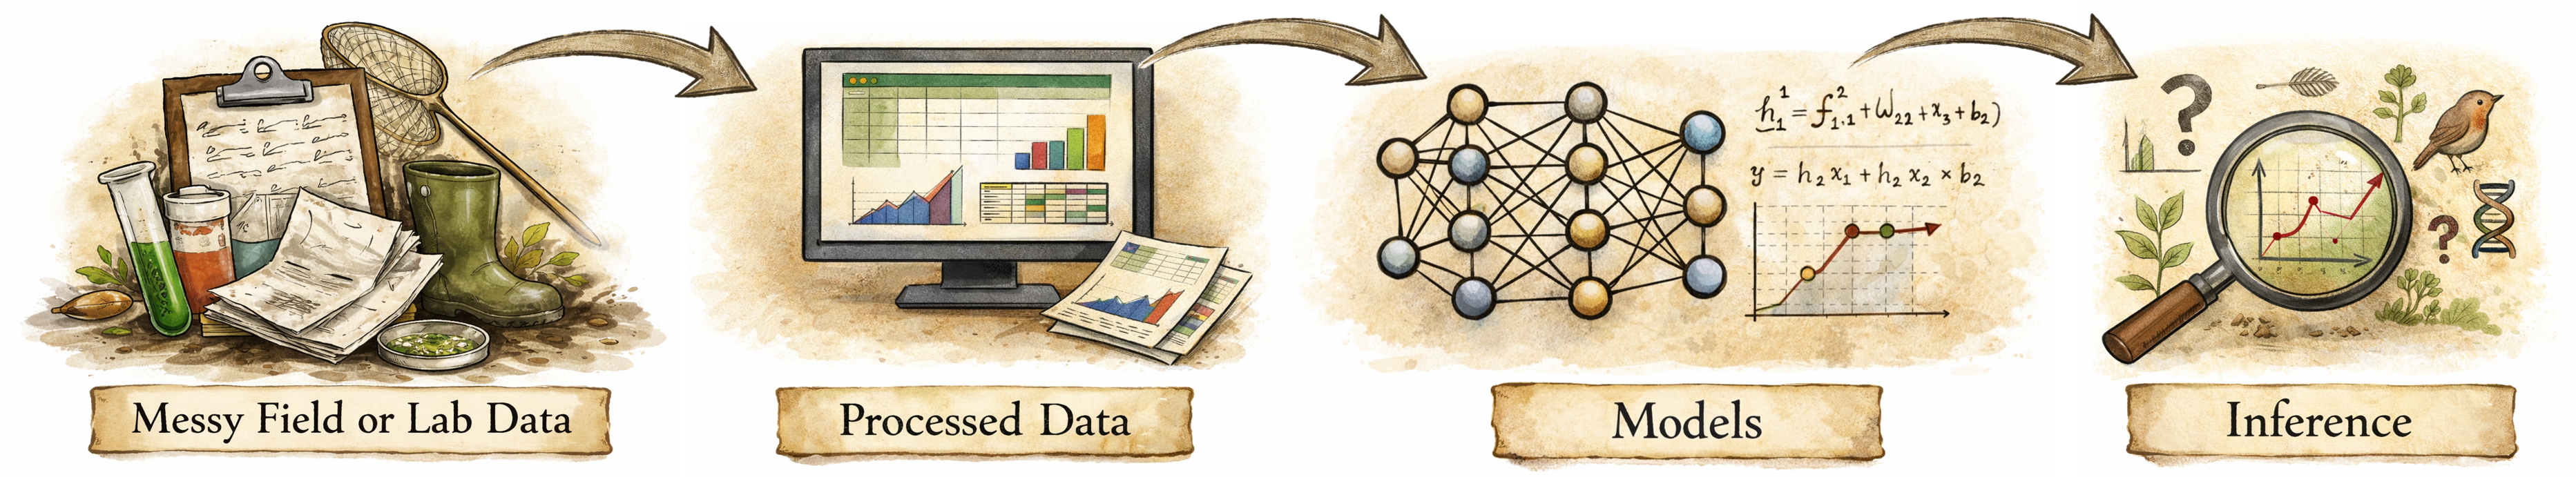
The complexity of the project, difficulty of field conditions, or an impending deadline can make the jumps from data collection to inference horribly daunting to young and old researchers alike. Our joint goal in this course is to become more comfortable with each of these steps, so that we not only work more efficiently but we also know a bit more about how to sense of our complex world. It is my sincerest hope that this course will not only teach you some about statistics (and some statistical traps) but that it will also give you a unique opportunity to work with your peers as you delve into the myriad issues that inevitably arise in data analysis. Working together means that we must first acknowledge that each one of us assimilates new material and produces syntheses in varied ways. All I ask is that each of you
2.2 Course Objectives
By the end of this course, you should be able to:
Think quantitatively about messy ecological data. You should be on your way to developing a habit of translating real-world ecological questions into quantitative frameworks, while explicitly acknowledging uncertainty and bias in estimation and measurement.
Distinguish between questions/hypotheses, data, and inferences. You should be able to (1) clearly separate ecological hypotheses, the data actually collected, and the quantities being estimated, and (2) understand why these distinctions matter for interpretation and decision-making.
Understand the processes that generate data. You should be able to recognize how different study designs, variation in detection, observer effects, instrument error, and data processing shape and constrain the structure of ecological datasets.
Select, build, and critique statistical models as scientific tools. You should be comfortable choosing and using statistical models not as black boxes, but as explicit representations of assumptions about ecological processes, variation, and causal structure. You should never blindly choose a statistical model again!
Interpret results in ecological —not just statistical— terms. You should be able to conceptually move beyond p-values and coefficients to clearly articulate what your results mean biologically, mechanistically, and practically.
Be comfortable applying causal –and not just correlational– reasoning. You should be able to use causal thinking (conceptual models and directed acyclic graphs) to evaluate what can —and ehat cannot— be inferred from observational and experimental data.
Communicate quantitative results clearly, transparently, and honestl.y Present analyses, figures, and conclusions in ways that are transparent, reproducible, and appropriate for scientific audiences.
Develop durable, reproducible analytical workflows. You should be increasingly comfortable with good data-science practices that support clarity, versioning (even though we will not delve into GitHub this term), and reusability of analyses.
Develop new confidence working with unfamiliar, complex, imperfect datasets. You should leave this course better prepared to engage with real ecological data —without expecting it to be clean, complete, or simple.
Topics covered
The course covers the following topics, roughly in the following order:
- Metrology: measurands, measurement error, uncertainty, and data quality
- Exploratory data analysis of messy data
- Generalized Linear Models (GLMs): theory and implementation
- Model comparison using AIC and information-theoretic approaches
- Generalized Linear Mixed Models (GLMMs) and effective sample size
- Generalized Additive Models (GAMs)
- Generalized Additive Mixed Models (GAMMs)
- Modeling spatial and temporal heterogeneity
- Structural Causal Modeling (SCM) and causal diagrams
- Prediction, uncertainty propagation, and model validation
- Synthesis of analytical results and justification of inference
- Tables, figures, and reporting standards for quantitative results
- Writing defensible and interpretable Results sections
Given this ambitious scope, we may only scratch the surface of some topics. Even our cursory treatment is aimed at convincing you why these subjects matter for scientists who have messy data.
2.3 What is new this term (Spring 2026)?
For Spring 2026, I have added attention to new topics that improve both efficiency of analysis workflows and our ability to understand causality at a deeper level. Specifically, I have chosen to add course components on:
- Using large-language models (LLMs) –via ChatGPT– to improve analytical workflows. This term, I have integrated ChatGPT into the course as a way to support the process of analysis rather than to automate the analysis itself. Many of the hardest parts of quantitative work happen outside of writing code: figuring out why R code isn’t behaving as expected, checking whether an interpretation actually follows from a model, troubleshooting an obscure error message, or getting feedback on how tp clearly document a decision. Used carefully, ChatGPT can act like a sounding board for troubleshooting, sanity-checking, and refining explanations without taking over your critical thinking. Throughout the course, I have deliberately constrained ChatGPT’s role and scope and have tailored its guardrails to match the course progression. In other words, ChatGPT is used to help improve analytical workflow and decision-making, not to generate results or write code on a student’s behalf. We will work together to assess the utility of this tool as the term advances.
- Using large-language models (LLMs) to improve teaching at scale. What does this mean? In past terms, between 10-15 students have been enrolled in this course. This term, I have allowed 26 students to enroll. Without a Teaching Assistant, this spawns a significant issue of scale. This is solvable if we use AI as a helpful tool. So, after spending some time as an LLM-consultant and tester, I decided to explicitly integrate chatGPT’s LLMs into my teaching/grading workflow. This means that students will use a custom GPT that I created specifically for ZOO/ECOL-5500 called JackalopeGPT (using ChatGPT) to run checks on their work prior to submission; this will solve some of the “tuning” issues (with codes, grammar, clarity, etc.) that I have seen in student submissions in previous years.
![]()
Structural Causal Models (SCMs) I added Structural Causal Models (SCMs) at the end of the course to give us a way to think more clearly about complex systems where multiple variables influence each other at the same time. In the first part of the course, students will see the limits of fitting separate models (e.g. GLMs, GLMMs, GAMMs) for singular response variables; those models can work individually, but they often miss shared drivers, indirect effects, or how pieces of the complex system of exogenous and endogenous factors fit together. SCMs give us a way to lay out those relationships explicitly and analyze them as a connected structure (as is present in natural systems) rather than as a collection of isolated models. The goal isn’t to replace the modeling approaches we’ve already used but to improve inference by making our assumptions about the system clear and coherent.
Jackalopes! This course corrects a long-standing perspective that (1) jackalopes had deer-like antlers (Fig. 1), and (2) there was only a single species of jackalopes (Fig. 2). We will use the newly discovered cryptid ecosystem for course exercises and examples.